
We confirm our estimates for Re and hence Ro worldwide.
We have developed spreadsheets simulating the spread of COVID-19 based on a specific daily increase in case numbers (r).
We extend our spreadsheet to utilise a range of values for r.
As a result of the original simulations we have developed a formula for calculating Ro. See the WELCOME menu for the formula.
Historically we have estimated Re and hence Ro for a daily increase in case numbers (r) for r = 1.4, r = SQRT(2) and r = SQRT(3) individually in separate spreadsheets.
Once provided with a value for r, the extended spreadsheet also simulates/ calculates results for 40 outbreaks and finds the means for each.
The overall mean is an estimates for Re and hence Ro.
Consider this analogous to application of the Central Limit Theorem.
This spreadsheet contains over 8.9 million non-empty cells.
If printed out about 38,000 (37,989) pages would be printed.
Each long column has almost 100,000 (at least 99,470) non-empty cells.
For each case we randomly select which previous case infected the case and count how many cases each case infects.
We assume that infectivity reduces by a factor of 1/r each day over a 10-day period.
Results for simulations are at the end of this post.
Previously we had the worldwide ranking below (see r1 and Re1 columns) for the 2020 outbreak (note: r1 is without weights; r2 is with weights, 0.25 and 0.75; see the WELCOME menu):
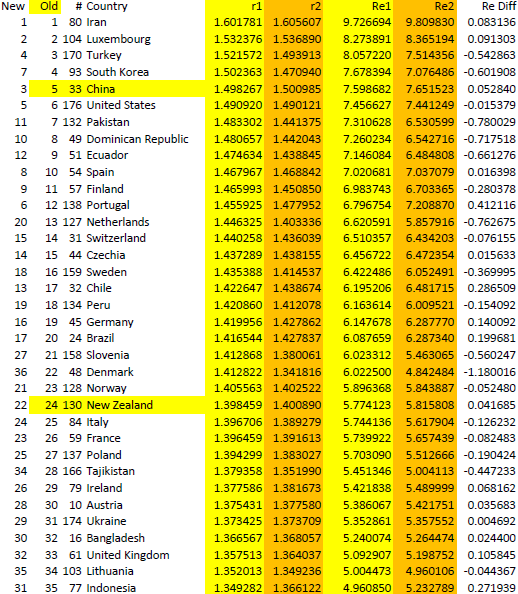
Estimates for r were calculated for over 175 countries up to August 2020.
The PFS below are more extensive and may be easier to read
(note that UK is #32 or #33; US is #5 or #6):
Below the last column shows estimates for Re and Ro for some values of r:

For estimates for Re and hence Ro using our formula see the second column in these PDFs:
CasesReRoAll2
For background and our formula see the Welcome menu:
COVID Odyssey: Worldwide Winter Windup 5 ~ Revised estimates for Re worldwide
Once provided with a value for r, the spreadsheet calculates 40 outbreaks and finds the means for each.
The overall mean is an estimates for Re and Ro.
Below are some results:
(only the first 15 simulations/outbreaks of the 40 are shown):

The PDF for this simulation is below showing all 40 means and normalised values:
CSAWsimT14B


One Comment Add yours